Risk Monitor
Risk management directly in Jira Cloud — structured, traceable, team-centric.
Risk Monitor supports an ISO-oriented risk process — from identification through analysis and assessment to treatment — directly in your existing Jira projects. Many parameters are configurable; for a start, default values and the steps under Getting started are enough.
Jira and Atlassian are trademarks of Atlassian Pty Ltd. Risk Monitor is developed independently and is not affiliated with or endorsed by Atlassian.
Getting started
After installation, first make the one global admin decision on project visibility — then project admins can take over configuration, issues, and the dashboard. Not all tabs need to be filled in immediately.
-
Core decision after installation
Where: Jira settings → Apps → Risk Monitor Administration (global admin)
- Under general settings / application scope, decide whether Risk Monitor is visible only in selected projects — or remains open to all.
- Default: all projects can see and use the app.
Later: All following steps can also be done by a project administrator — global admin rights are not required.
-
Configuration
Where: Risk Monitor Configuration (project → project settings; profiles in global admin)
- At the top, choose a project-specific profile (for one project or group) or general settings. “Standard Settings” can only be changed with global admin rights.
- First set the language in general settings — that makes all further steps easier.
- Then work through the tabs in order. You can go back and add details anytime:
- Protection goals: enable only if relevant — otherwise leave empty.
- Risk categories: define what you need.
- Assets: can be added later.
- Likelihood, discovery, impact: choose desired scales; adjust scale size with the slider.
- Risk matrix: easiest in graphical mode — adjust the assessment matrix by click.
- Risk review: set the interval for your reviews.
- General settings: enable options you want to use (detailed descriptions of individual options will follow on the website later).
-
Issue panel
Where: Risk issue in Jira
- Add Risk Monitor per issue: gear icon at the top of the issue view.
- Fill in as much as possible — go through all tabs (assessment, treatment, administration, notes).
- Warnings help with completeness; you can dismiss them and show them again in the notes tab.
-
Dashboard
Where: Apps menu in the top bar → Risk Monitor Dashboard
- Open the dashboard from the app overview (top row).
- Click a cell in the risk matrix to see the issues behind a square.
- Use trend and history comparisons once at least one historical data point is saved in admin.
Later: Further tabs (assets, SoA, export) as needed.
What comes when?
Global admin
Project visibility of the app; changes to standard settings / global profiles.
Configuration
Profile, language, protection goals, categories, scales, matrix, reviews — global or per project.
Issue & dashboard
Assessment and tabs on the issue; portfolio matrix and history in the dashboard.
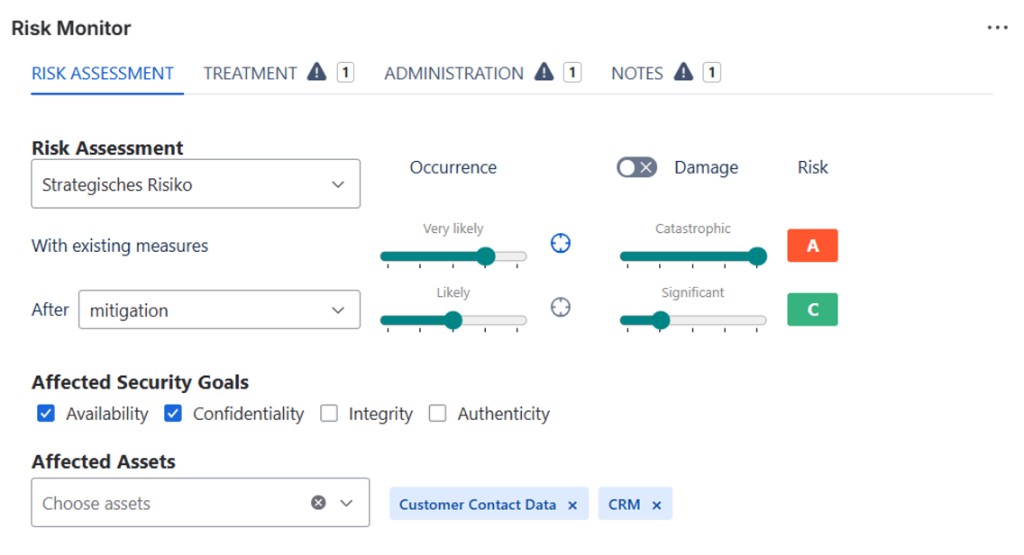
Issue panel
- Risk assessment with likelihood and impact — before and after mitigation
- Risk classes A, B, and C directly on the issue
- Affected protection goals (availability, confidentiality, integrity, authenticity)
- Link affected assets
- Tabs for treatment, administration, and notes with plausibility checks
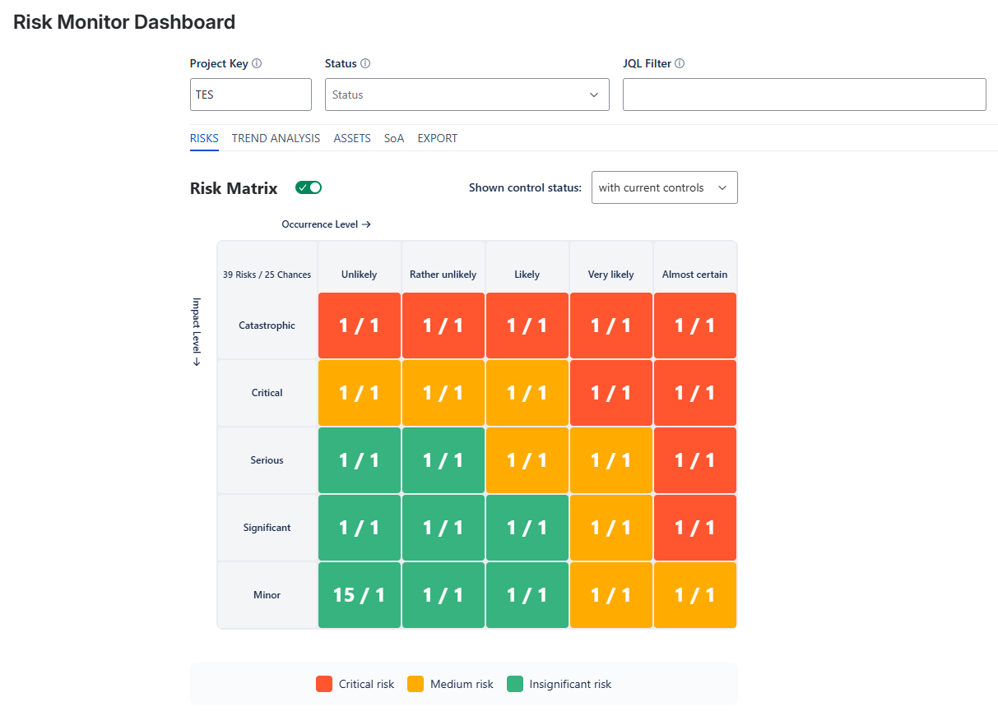
Project panel (dashboard)
- 5×5 risk matrix by likelihood and impact level
- Filter by project, status, and JQL
- Tabs: risks, trend analysis, assets, SoA (statement of applicability), export
- Toggle measure status (e.g. with current measures)
- Export to Excel or Word for evidence and reports
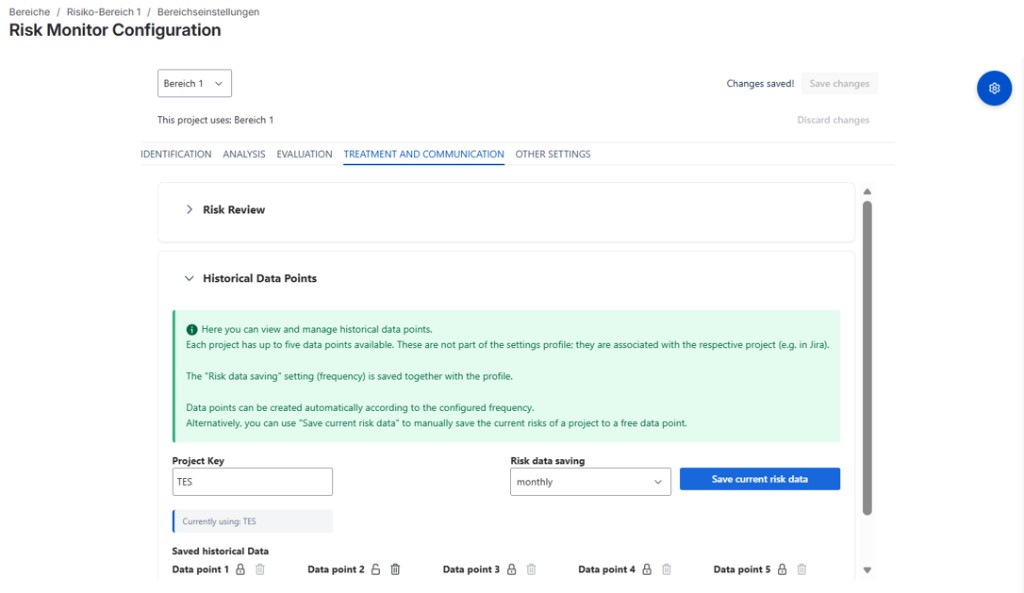
Administration & configuration
- ISO-oriented workflow: identification, analysis, assessment, treatment
- Configuration profiles (“scopes”) for multiple projects
- Global management in Jira settings; project assignment in project settings
- Historical data points (up to five per project, manual or by frequency)
- Maintain scales, matrix method, assets, categories, and catalogues centrally
Your benefits
Stay in Jira
Risks as issues — without parallel Excel lists or isolated tools.
Traceable assessment
Consistent matrix, protection goals, and documentation per risk.
Portfolio overview
Heatmap, filters, and trends on the project dashboard.
Export & evidence
SoA, asset lists, and reports for audits and management.
Frequently asked questions
Which Jira versions is Risk Monitor for?
Where do I install the app?
What is the difference between global admin, project configuration, and the issue panel?
What is a configuration profile (“scope”)?
Where do I configure the risk matrix?
The “Risk Monitor” panel does not appear on the issue — what to check?
Does Risk Monitor support opportunities as well?
What are historical data points?
Where is data stored?
storage:app) and Jira API access for issues. There is no separate HEURECON database outside your Atlassian environment.Which languages is the UI available in?
How do I get support or a demo?
Demo or support
Installation or configuration questions? We help you get started.
Contact supportComing soon on the Atlassian Marketplace.